

|
5 min read
The Breakout Scale, and how we apply it
A six-point measure of how far an operation has travelled — built to be usable at the moment of detection, not after the post-mortem.
Measuring the impact of an influence operation is the hardest thing in this field, and for a long time the honest answer was that nobody could. The people running operations struggle to measure their own; researchers on the outside, with no reliable insight into what an operation was trying to achieve, had it worse.
Ben Nimmo's response, published by Brookings in September 2020, was to stop trying to measure the thing that can't be measured. The Breakout Scale doesn't attempt to establish whether anyone's behaviour or belief changed. It measures how far the operation's content escaped its origin — using data that is observable, replicable, verifiable, and available from the moment the material was posted. [1]
That last constraint is what makes it operational rather than academic. You can apply it in the first hour.
The six categories
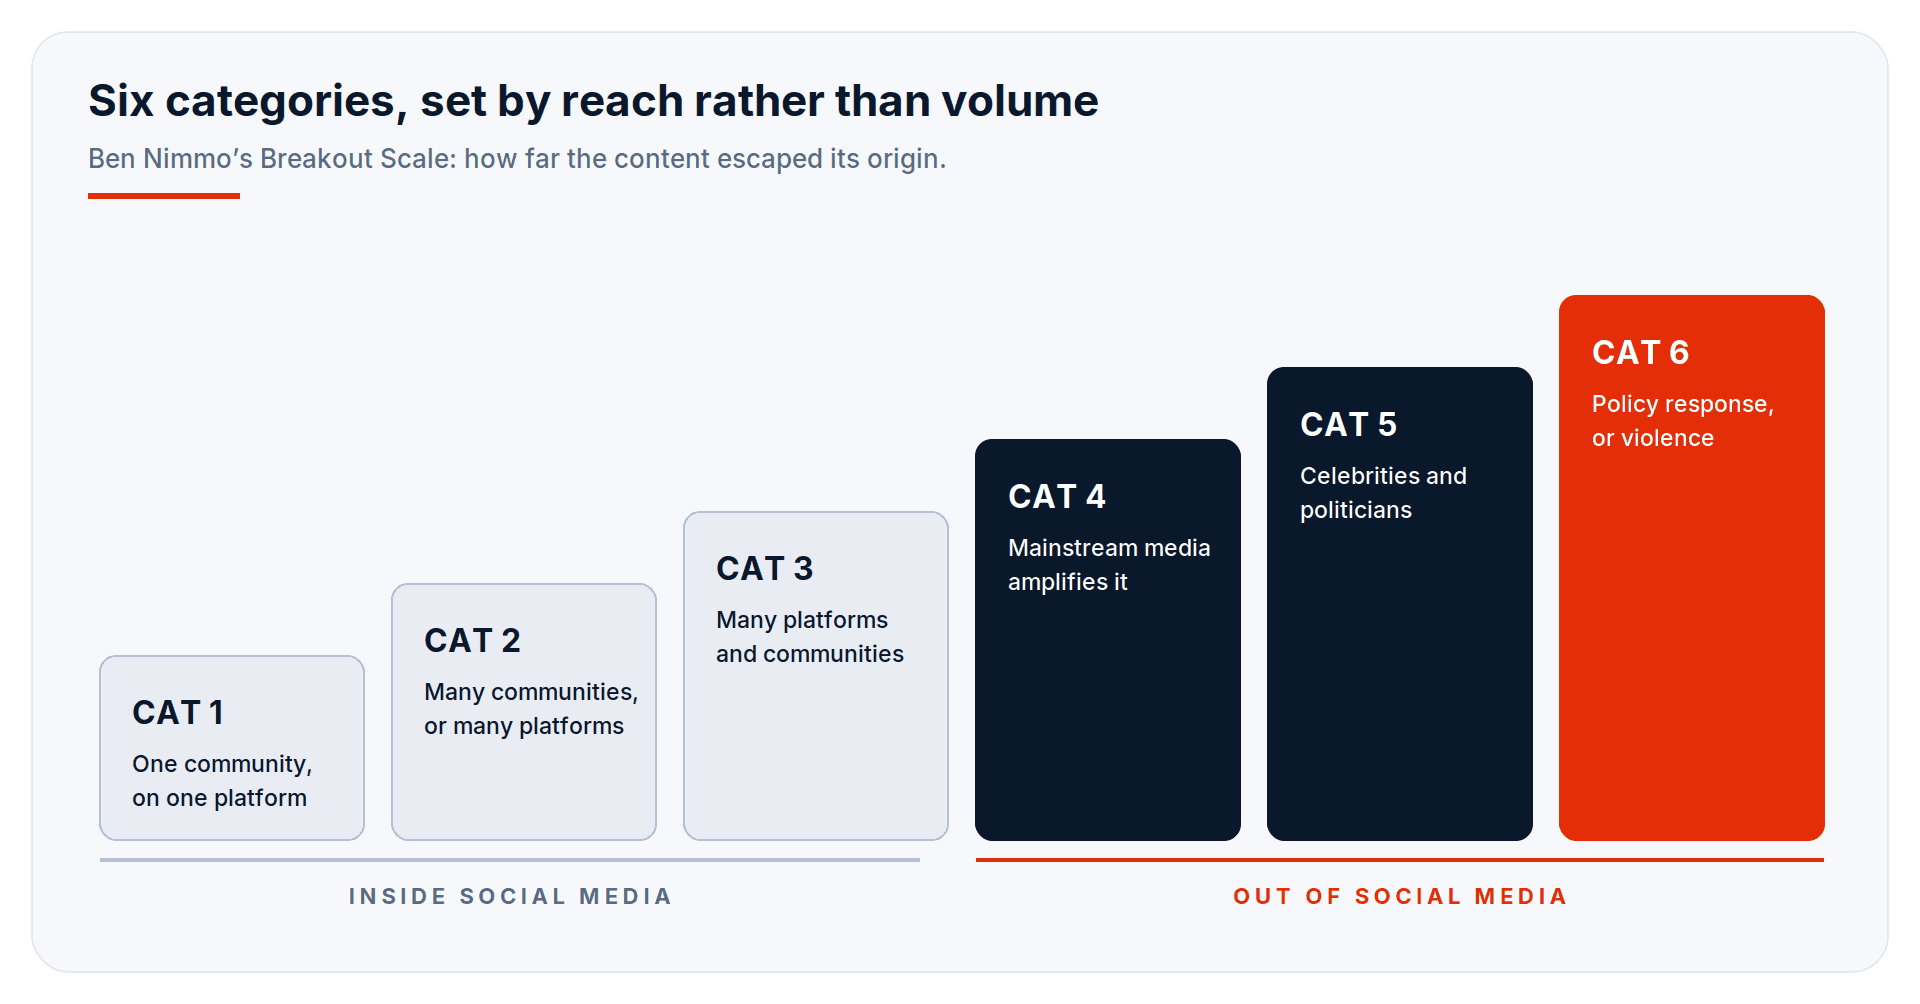
The scale is built on two dimensions: whether content stays on one platform or crosses several, and whether it stays inside one community or spreads across many.
Category 1 — Contained. The operation spreads within a single community on a single platform.
Category 2 — One dimension broken. Either it spreads across communities on one platform, or within one community across multiple platforms.
Category 3 — Both broken. It spreads across multiple platforms and reaches multiple communities, but stays inside social media.
Category 4 — Out of social media. Mainstream media picks it up and amplifies it.
Category 5 — Amplified by high-profile individuals — celebrities, political candidates, public figures with independent reach.
Category 6 — It triggers a policy response or some other concrete real-world action, or it contains a call for violence. [2]
The design point is that positioning depends on reach, not on volume or effort. A single well-placed post can hit Category 4 within hours. Thousands of posts from hundreds of accounts can sit at Category 1 indefinitely. Any metric built on post counts will rank those two the wrong way round. [3]
How we apply it
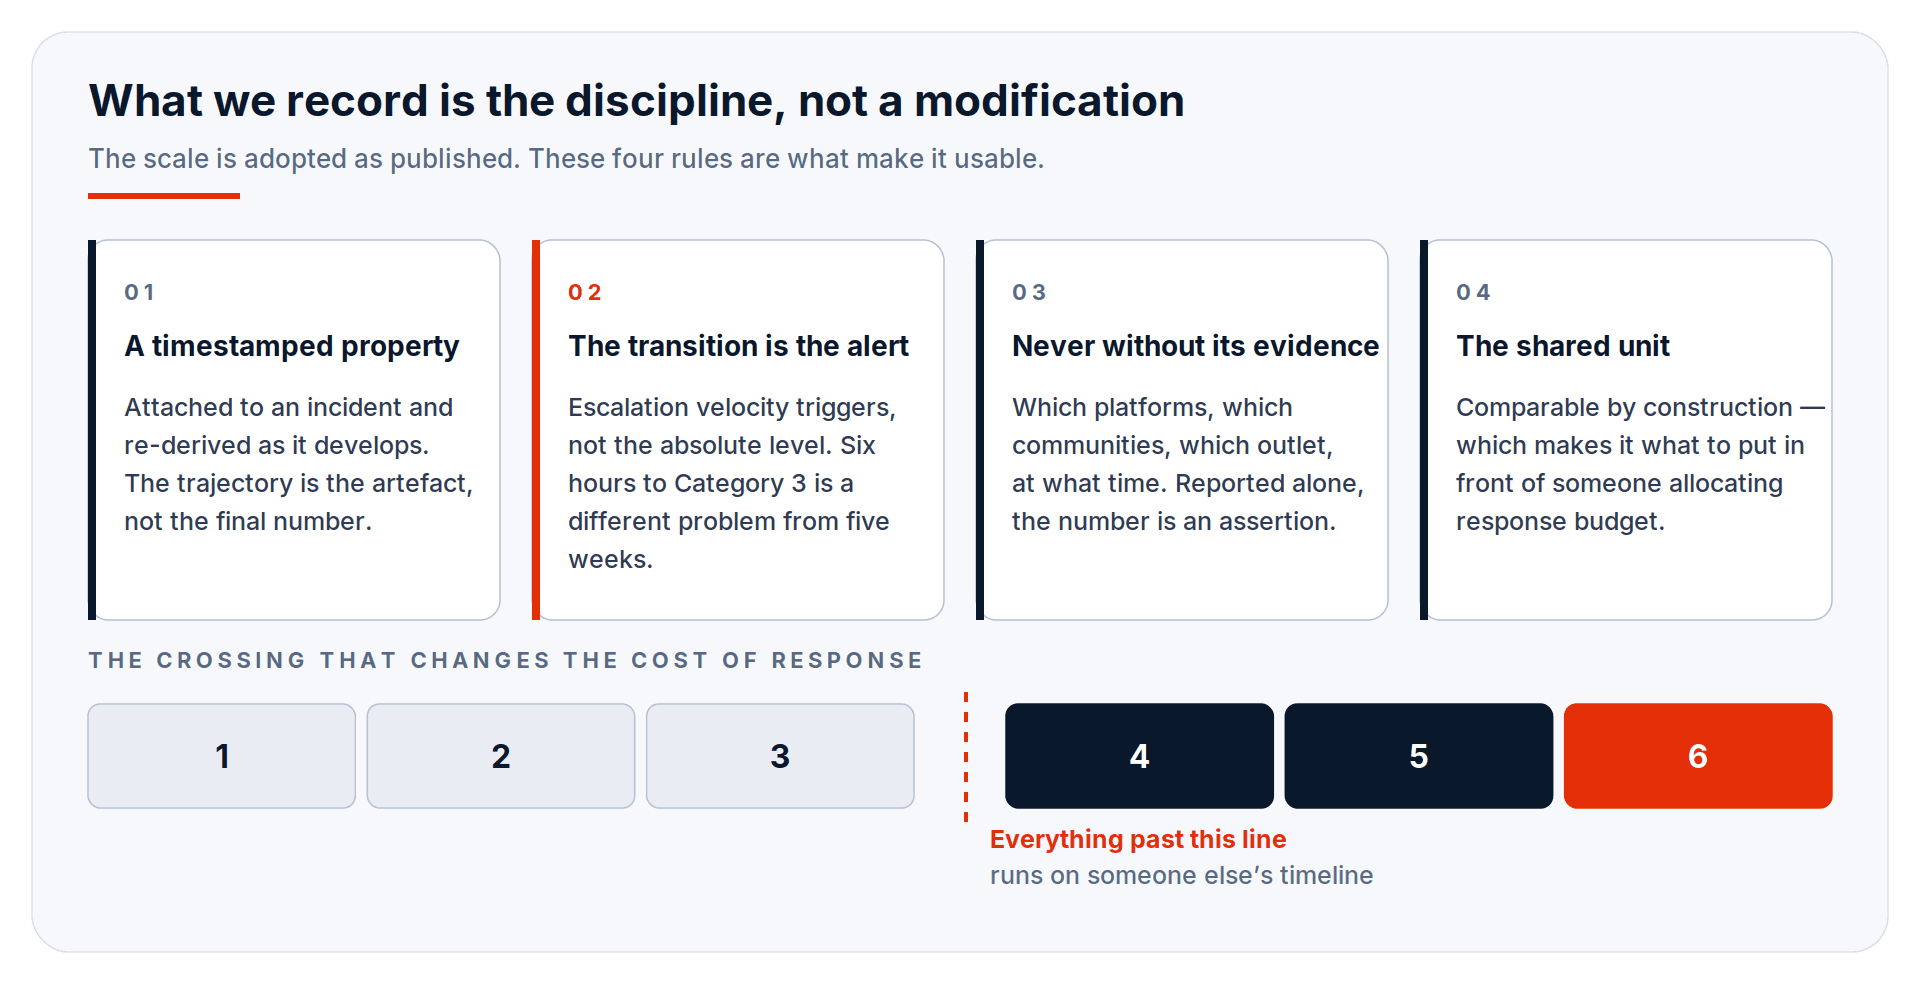
The scale sits inside our framework as an adopted standard, not a modified one. [4] We use it as published. What we've built around it is the discipline of how it gets recorded.
It's a property that changes over time, not a score. A category is attached to an incident with a timestamp, and re-derived as the incident develops. The interesting artefact is the trajectory, not the final number. An operation that reaches Category 3 in six hours is a different problem from one that arrives there over five weeks, and the two warrant different responses even though they occupy the same row.
The transition is the alert, not the level. Escalation velocity is what we treat as the trigger — particularly the crossing from 3 to 4, where content leaves social media for mainstream coverage. That crossing is the point at which the cost and complexity of response step up sharply, because everything downstream of it involves institutions that respond on their own timelines. Detecting the approach to that boundary is worth considerably more than describing the crossing afterwards.
Never a category without its evidence. A category is only intelligence if the observation that produced it is recorded alongside it — which platforms, which communities, which outlet, which account, at what time. Reported alone, the number is an assertion. Reported with the crossings that earned it, it can be checked, challenged, and re-derived by someone else. This is the same standard we hold for any other analytic claim, and the scale is unusually well suited to it, because every category boundary corresponds to a specific, citable observation.
It's the shared unit between the analyst and the executive. Most of what a narrative intelligence team produces is difficult to compare across cases. Breakout categories are comparable by construction, which makes the scale the most useful thing to put in front of someone deciding where to spend a response budget across four simultaneous incidents.
What it doesn't measure
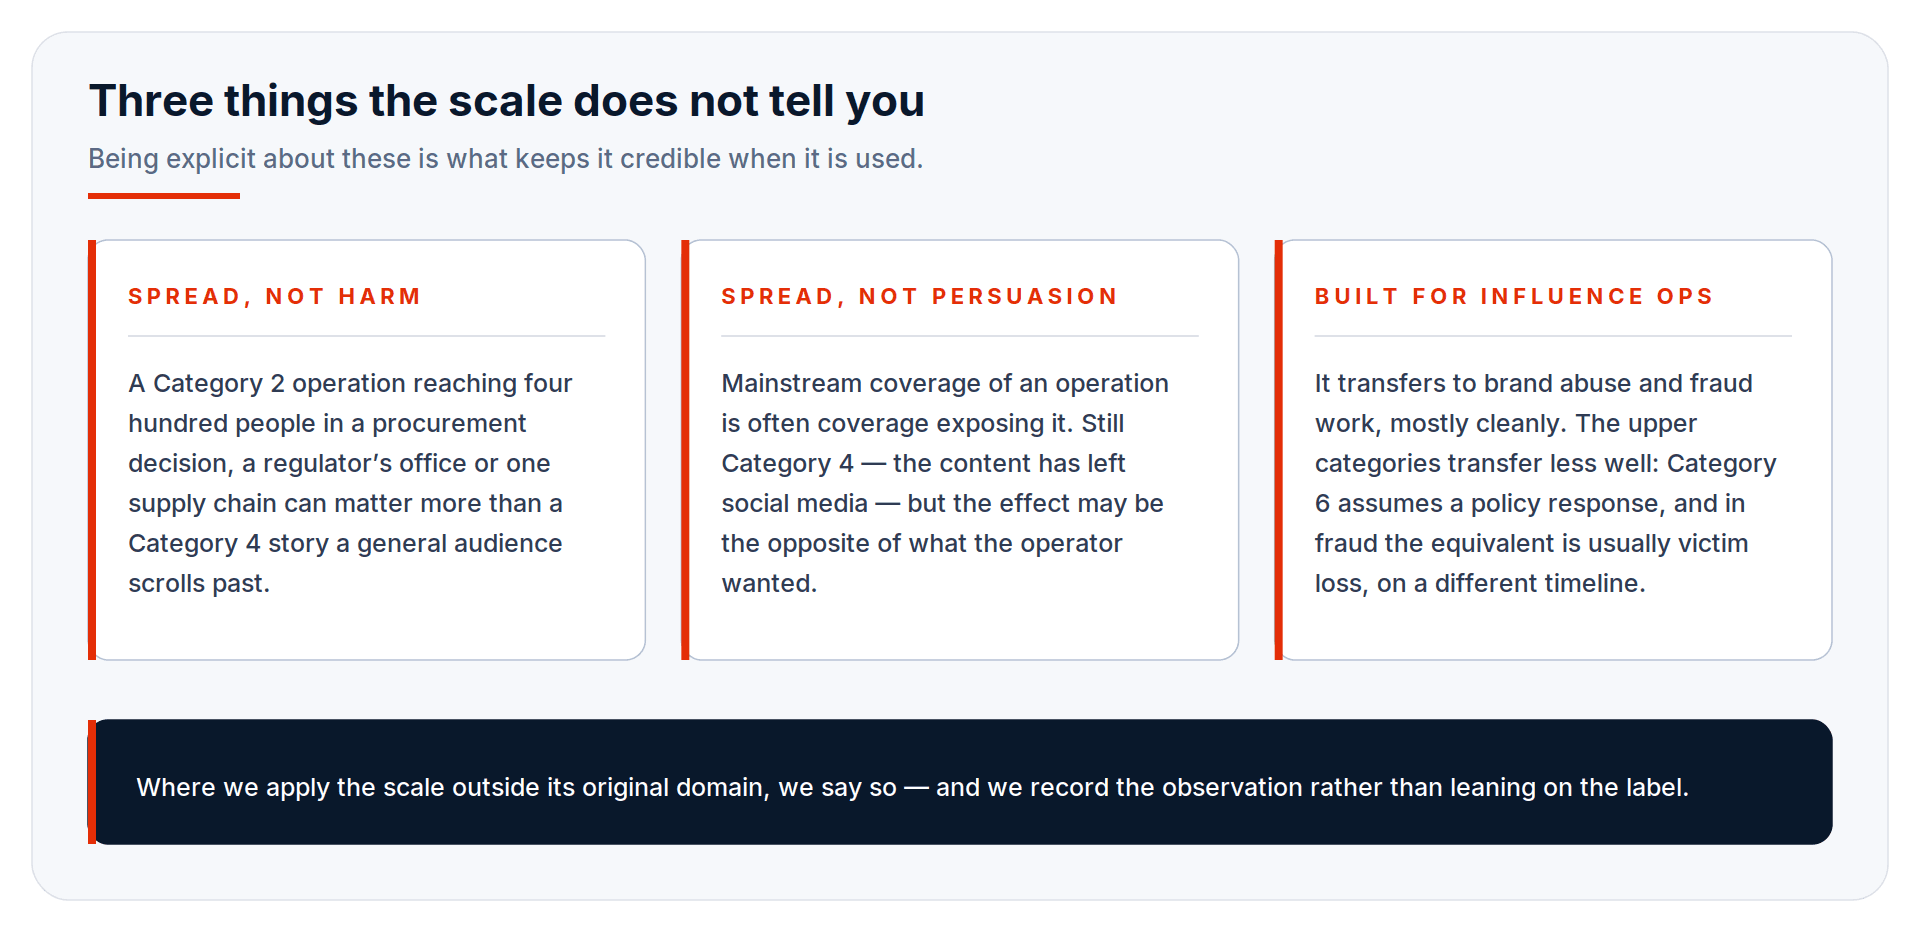
Being clear about this is what keeps the scale credible when it's used.
It measures spread, not harm. These correlate loosely and diverge often. A Category 2 operation reaching four hundred people who happen to sit in a procurement decision, a regulator's office, or a single supply chain can matter more than a Category 4 story that a general audience scrolls past. Where a defined population is the target, exposure within that population is the relevant measure, and the Breakout Scale doesn't capture it.
It measures spread, not persuasion. Mainstream coverage of an operation is often coverage exposing it. That still counts as Category 4 — the content has left social media — but the effect may be the opposite of what the operator wanted. The scale tells you the material travelled. It does not tell you what it did on arrival.
It was built for influence operations. We use it in brand-abuse and fraud work too, and mostly it transfers cleanly: a scam narrative crossing from a closed Telegram channel into paid social and then into press coverage is a recognisable escalation. The upper categories transfer less well. Category 6 assumes a policy response, and in a fraud context the equivalent real-world action is usually victim loss, which is a different kind of event on a different timeline. Where we apply the scale outside its original domain, we say so, and we record the observation rather than leaning on the label.
Notes
Ben Nimmo, The Breakout Scale: Measuring the Impact of Influence Operations (Washington, DC: Brookings Institution, September 2020), https://www.brookings.edu/wp-content/uploads/2020/09/Nimmo_influence_operations_PDF.pdf. The original paper; the design constraint quoted here — observable, replicable, verifiable data available from the moment of posting — is what makes the scale usable in real time rather than only in retrospect. ↩
Nimmo, The Breakout Scale. Source of the six categories as summarised here, including the two dimensions (platforms crossed, communities reached) that determine placement in categories one through three. ↩
Nimmo, The Breakout Scale. The scale measures how far content has broken out from its origin rather than how much of it there is, which is the specific reason volume-based metrics mis-rank operations. ↩
Nimmo, "Video: Ben Nimmo on Influence Operations and the Breakout Scale," interview by Elias Groll, Brookings TechStream, October 2020, https://www.brookings.edu/articles/video-ben-nimmo-on-influence-operations-and-the-breakout-scale. Nimmo's own account of the reasoning behind the scale — useful background for the point made here, that the scale deliberately avoids measuring behavioural change in the targeted audience. ↩